How to Measure Waste Across 50 Locations Without Adding Headcount
The request usually arrives in a plain form. Someone in finance or sustainability asks for waste by site, and the operations team assembles it — a spreadsheet with fifty rows, pulled from fifty billing relationships, over about three weeks of email. Then somebody looks at the spreadsheet and asks why one distribution center appears to generate four times the waste of an identical one two states over.
The answer is almost never that it does. It is that the two numbers were produced differently. One came from a hauler that bills by weight, the other from a hauler that bills per pull and estimates tonnage from container volume. One site’s figure covers a calendar month, the other a 28-day billing cycle. One includes cardboard hauled by a separate recycler; the other does not, because that vendor invoices a different cost center. Every one of those differences is defensible on its own, and together they make the portfolio uncomparable.
This post is about the specific problem of getting comparable waste data across a large site count — not more data, comparable data — without adding a person at every location to produce it.
Why do my sites’ waste numbers not compare?
There are four independent sources of incomparability, and a portfolio at scale usually has all four at once.
Some figures are weighed at a scale. Some are estimated from container size times fill assumption times pulls. These are not the same kind of number and averaging them produces a third thing that means nothing.
Billing cycles, calendar months, and fiscal periods do not align. A site with 13 four-week cycles and a site with 12 calendar months will disagree on any annual total until both are re-cut onto a common calendar.
Trash, single-stream recycling, cardboard, organics, grease, e-waste, and construction debris are often handled by different vendors billing different cost centers. Portfolio totals silently include or exclude streams site by site.
Vendor account numbers rarely match your own property IDs. Acquisitions, rebrandings, and closures leave residue — including active service at sites that no longer operate.
None of these are exotic. They are the normal state of a portfolio that grew by acquisition and manages waste locally, which is nearly every portfolio above about twenty locations. The work of fixing them is unglamorous and it is the precondition for everything else.
What does “comparable” actually require?
It is worth being precise, because “we need better waste data” is a goal nobody can execute against. Comparable means four properties hold simultaneously.
Same quantity. A weight in pounds or tons, from a stated source, not a volume converted by an assumed density. Volume-to-weight conversion is a large source of error in portfolio waste data, because the density of loose cardboard and the density of wet food waste are not remotely alike — which is why EPA reports national waste figures on a material basis rather than by container. If you must convert, the factor and its source belong in the record next to the number.
Same taxonomy. A stream label that means the same thing at every site. This is harder than it sounds, because the words used on the floor differ legitimately — a resort kitchen, a stadium concourse, and a warehouse do not generate the same materials. The resolution is not to force one dropdown on everyone; it is to let each site use its own vocabulary and map those local labels into one hierarchy on the reporting side.
Same period. Every quantity assigned to a defined calendar period, with billing cycles re-cut rather than approximated. This is arithmetic, but it has to be done once, centrally, and consistently.
Same stated boundary. An explicit list of which streams and which vendors are inside the number. The GHG Protocol Corporate Value Chain (Scope 3) Standard is built around exactly this discipline — completeness and consistency as stated principles, with the boundary and the data sources disclosed rather than assumed — and the same requirement applies whether you are reporting emissions or just comparing two warehouses.
Comparability is a normalization problem before it is a collection problem
Most portfolios already have more waste data than they use. What they lack is a single mapping of vendor accounts to their own site hierarchy, one stream hierarchy, and one calendar. Collecting more before doing that work produces a larger pile of the same incomparable numbers.
How do I get consistent data without adding headcount at every site?
The constraint that governs every design decision here is that no site has a spare person. Any scheme requiring a site coordinator to compile, transcribe, or email something monthly will work for one quarter and then decay — first at the busiest sites, which are also the ones you most need data from. That decay is not a training failure. It is the predictable result of assigning recurring administrative work to people whose actual job is moving material — and any capture scheme that adds physical handling on top of that runs into the same design principle OSHA’s ergonomics guidance applies to manual material handling: engineer the step out rather than train around it.
There are three ways to get consistent data that do not add site labor, and a serious program uses all three for different purposes.
Capture at the vendor layer. Invoices and contracts arrive centrally and are parsed centrally — via APIs, EDI, email parsers, and PDF OCR — then normalized for periods, units, duplicates, and facility IDs. This is how Spend Intelligence works, and it costs the sites nothing because the documents were already being sent somewhere. Its limit is that it can only tell you what you were billed, which is a different fact from what you threw away. That distinction is the subject of a separate post on reading hauler invoices.
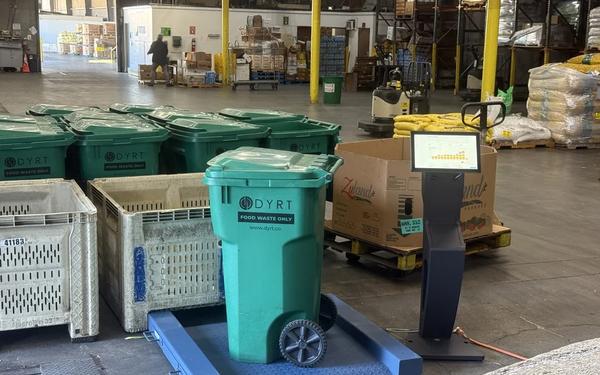
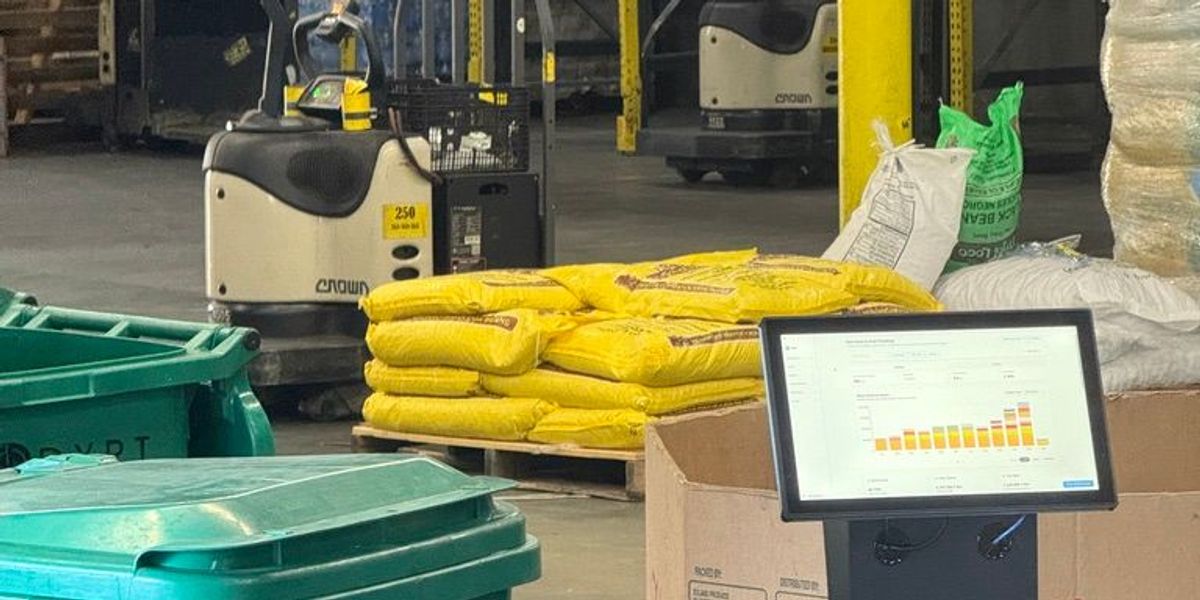
Capture at the point of generation. A weight taken at the dock as material leaves the building is the only measurement that is independent of the hauler and independent of billing. A DWIT kiosk does this with an industrial floor scale and a three-tap workflow — load, select, confirm — designed so the marginal cost falls on the person already moving the bin rather than on a new coordinator role. Devices used commercially for weight are governed by the specifications and tolerances in NIST Handbook 44 and type-evaluated through NTEP; the practical point for a portfolio is that a scale produces the same kind of number in Ohio and in Nevada, which is precisely what a hauler’s estimate does not.
Capture at the facility layer. Where material goes to a facility that weighs and characterizes it, that data can be pulled directly. This is the most accurate and the least available, since it depends on the downstream operator’s systems and willingness.
The offline behavior is not a footnote at portfolio scale. Back-of-house connectivity is unreliable in a way that corporate IT consistently underestimates, and a capture system that stops recording during an outage will have its worst gaps at exactly the sites with the worst infrastructure — introducing a bias that correlates with site type and is very difficult to detect after the fact.
What should I compare across sites — tons, or something else?
Absolute tonnage is nearly useless for comparison, because it mostly measures site size. A 900-room resort will always generate more than a 200-room select-service hotel, and knowing that tells you nothing about which one is run well. Comparison requires a denominator, and choosing it is a judgment call that should be made once and documented.
Choosing a denominator by property type
| Property type | Workable normalizer | What it exposes | What it hides |
|---|---|---|---|
| Hotel / resort | Pounds per occupied room-night | F&B intensity and banquet volume | Shifts in the mix of business versus leisure stays |
| Stadium / venue | Pounds per attendee per event | Concession packaging and event-type differences | Non-event-day operations and construction periods |
| Retail store | Pounds per thousand square feet, or per transaction | Inbound packaging and cardboard handling | Differences in store format and backroom capacity |
| Distribution center | Pounds per thousand units shipped | Packaging design and damage rates | Seasonal throughput swings against fixed overhead |
| Any type | Pounds per stream as a share of total | Diversion performance and contamination, independent of size | Absolute volume — a good rate on a large number is still a large number |
The last row is the one most portfolios should start with, because stream share requires no external denominator at all. If a warehouse sends 70 percent of its weight to landfill and a comparable warehouse sends 30 percent, that difference is real and actionable without agreeing on units shipped, and it will usually point at a specific handling practice — cardboard not being baled, organics not separated, a recycling container being downgraded on arrival for contamination.
How do I roll this out across fifty sites without a fifty-site project?
Sequence it so that each phase produces something usable, and so that the sites bear as little of the coordination as possible.
The step teams most often skip is month three. Instrumenting a subset first tells you where measurement actually changes the answer — and it will not be everywhere. At some property types, billing-derived data turns out to be close enough for the decisions being made, and spending on capture there is a poor use of budget. At others the gap between billed service and real volume is large enough that every downstream number was wrong. You cannot know which is which by reasoning about it.
How do I know the data is trustworthy once it is flowing?
Build in three checks and look at them monthly.
Coverage. What fraction of expected records arrived, by site and by stream. A site whose capture rate quietly drops from 95 percent to 60 percent will still produce plausible-looking totals — lower ones, which is worse than obviously missing data because it reads as improvement. Coverage is the metric that catches this, and it should be reported next to every total.
Reconciliation. Measured tonnage against billed tonnage, per site per period. Persistent gaps in the same direction are informative rather than alarming: consistently lighter measured weight than billed weight is the signature of containers being pulled before they are full.
Classification stability. The distribution of loads across streams, watched over time. A sudden shift usually means a taxonomy change, a new staff member classifying differently, or a genuine operational change — and you want to know which before the number reaches a report.
These checks are also what makes the data usable for emissions work rather than just cost work. EPA’s WARM compares management pathways — source reduction, recycling, anaerobic digestion, composting, combustion, landfilling — on a material-specific basis, so an inventory built on it is only as good as the tonnage-by-material-by-destination underneath. That is the mechanism behind Impact Engine and the reason a measured Scope 3 Category 5 figure and a spend-derived one are different claims, covered in the post on measured Category 5.
One dataset, several audiences
Comparable tonnage by site, stream, and period is simultaneously the input to cost benchmarking, diversion reporting, and Scope 3 Category 5. Portfolios that build three separate datasets for three audiences end up reconciling them against each other forever. Build one and derive the rest.
The reason to do this work is not the dashboard. It is that every decision above the site level — which vendor to consolidate onto, which property type to target for diversion, which sites are genuinely outliers rather than just large — is currently being made on numbers that are not comparable. Making them comparable is unremarkable engineering. It is also the difference between managing a portfolio and managing fifty sites in parallel, which is the argument made at more length in the portfolio-scale post.
Dyrt Team
Dyrt Editorial
The Dyrt team builds waste intelligence software for sustainability managers, CFOs, and facility operators. We help organizations reduce waste costs, hit diversion targets, and simplify Scope 3 reporting.
Ready to Transform Your Waste Operations?
Dyrt helps sustainability teams, facility operators, and CFOs cut waste costs, hit diversion targets, and simplify Scope 3 reporting — all in one platform.
Request a Demo